
If a site loses connectivity, dozens of follow-on messages should not present the same outage as many separate incidents. Zabbix can bring together metrics, conditions and notifications. Practical value comes from asking which decision a message should trigger.
From the business process to the measurement
The starting point is a concrete service: an accessible business application, a backup completed on time or sufficient usable storage. Suitable technical measurement points are selected for it. A responding server does not establish that users can sign in to the application and obtain correct results.
Every relevant check receives an owner and an expected response. Capacity may need early planning; a failed production service may require a direct contact path. Importance follows from the effect on operations, rather than a particularly striking colour.
Dependencies reduce unnecessary notifications
Zabbix describes trigger dependencies as a way to handle dependent events appropriately when an upstream problem occurs. This can help distinguish the failure of a central connection from its consequences. The dependency must nevertheless match the real network and measurement logic.
A site outage must not hide a separate, independent incident. Relationships are therefore checked against actual failure scenarios. An excessive delay or an overly generous threshold can also conceal a real problem. A quiet notification list is insufficient evidence of good monitoring.

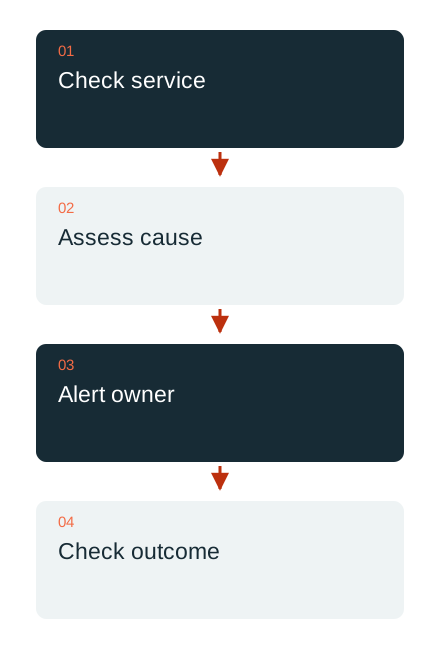
Plan maintenance windows and escalation
Planned maintenance is represented in monitoring. Zabbix distinguishes, among other things, how data collection and events are handled during maintenance. The chosen setting is checked deliberately instead of disabling all observation indiscriminately. After maintenance ends, normal operation must be recognisable again.
The notification path accounts for working hours, agreed response channels and cover arrangements. This does not establish a blanket round-the-clock commitment. Escalation is useful only if the person concerned can be reached and knows which information they will receive to assess the situation.
Test alerting as a function
A controlled test checks measurement, triggering, delivery, acknowledgement and resolution. The recovery notification is part of it too. A bounded scenario agreed in advance is preferable to an unplanned intervention in a production service.
DAXS develops monitoring with Zabbix to suit the environment and connects it with documentation and operations. A useful first step is a small number of important services with fully tested response paths. Further measurement points follow once their additional value is clear.
IT support and operations · Infrastructure · Discuss monitoring
Sources: Zabbix: trigger dependencies (external link) · Zabbix: maintenance windows (external link)